Beginner's guide to Google Analytics
Lesson 6 of 6 of our beginner's guide to SEO
What is Google Analytics
The whole purpose of a business website is to generate awareness, leads, and, ultimately sales. So it's important to know how many people are visiting your website and exactly how they are getting there.
Google Analytics is a powerful, widely-used web analytics application that records important statistics about your website such as traffic levels, bounce rates, average time on-site, page views and much more.
Best of all, it's free!
- Table of Contents
- 1. What is Google Analytics
- 2. Setting up Google Analytics on your website
- 3. The difference between accounts, properties and profiles
- 4. Dimensions vs. metrics: What's the difference?
- 5. Goals
- 6. Key Google Analytics reports
- 7. Real-Time
- 8. Audience
- 9. Acquisition
- 10. Keywords
- 11. Google Analytics and "not provided" data
- 12. Social
- 13. Behaviour
- 14. Landing pages
- 15. Exit pages
- 16. Site Speed
- 17. Conversions
- 18. Lessons
The huge amount of data and metrics Google Analytics provides not only supplies insight as to how your website is performing and benefitting your business, but also helps you improve your social media campaigns and traffic drives.
Google Analytics offers an in-depth look at many different performance metrics related to your website, some of which may be a little confusing for the first-time user.
Let's go over some of the key areas you should be focusing on.
Setting up Google Analytics on your website
Setting up Google Analytics is pretty straightforward, and very similar to the way you learned to set up Search Console in the previous lesson.
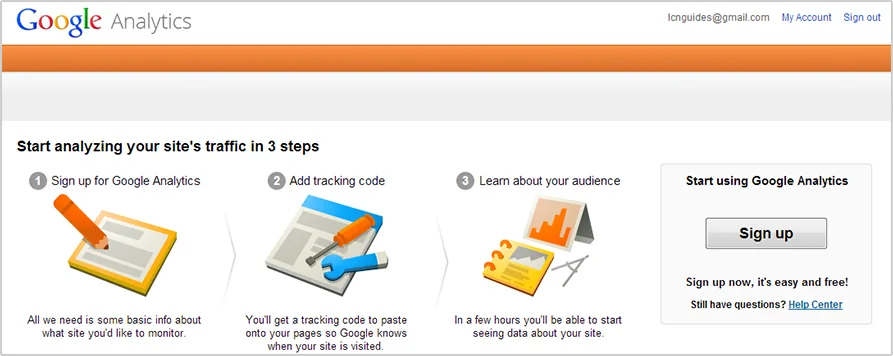
To begin, log into Google Analytics at www.google.com/analytics.
Analytics is a Google product, so you will need a Google Account. You’ll need to register if you don’t already have one, and will then be directed to the following page to begin set-up.
Click the "sign up" button the on the right to continue.
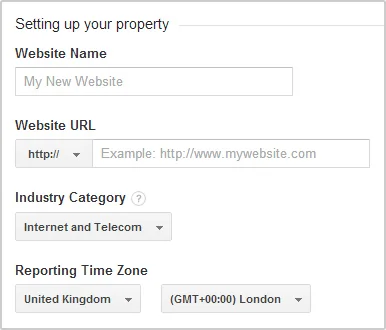
On the next page you’ll be prompted to set up your account and your property.
Your property is the website you wish to record Analytics data for. We will explain the difference between accounts and properties in further detail later in this guide.
Fill in the required fields of data such as your website name, URL, industry category and reporting time zone.
To continue, click the blue "Get Tracking ID" button to get your tracking code.
The code you receive on this page will need to be pasted into every single page you wish to track or collect data for on your website.
The easiest way to do this is to add the code into the <head></head> tags of your website. If you are unsure how to do this, consult your web designer – it should only take them a couple of minutes to complete this step.
Once this has been done, you can return to Analytics to check that data is now being received from your website.
Just click "Admin" from the top navigation bar, select your account and property, and look for "Tracking Info" from the list and select “Tracking code”.
From here, you should be able to see the tracking ID number alongside your "Status" which should say "Receiving Data".
Then hit the “Send test traffic” button and Google Analytics will open up your website in a pop up box. In turn this will generate an active user on the status section of the “Tracking code” page to confirm the code is set up correctly.
The difference between accounts, properties and profiles
Analytics has a distinct hierarchy, and is structured in three layers:
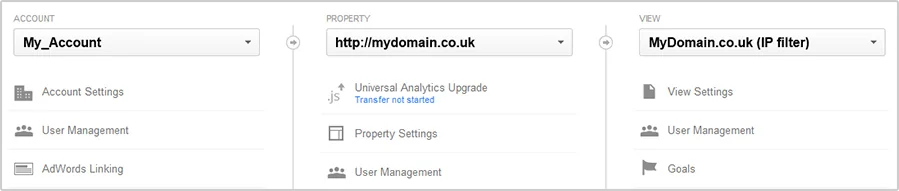
Account
Your account functions as the primary classification. Each company or business usually maintains a single account.
If you are implementing Google Analytics for a different company, for a personal website, or for a client, you should use an account separate from that of your business.
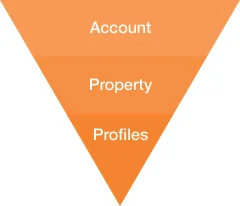
Property
Your property (or properties) can be found next to "Account".
Generally, a property is your website/domain name. Each property will receive a separate Analytics tracking code.
You will also receive a web property ID or UA code which will look something like this: UA-124241004-1.
The web property ID has two parts.
- the Xs (UA-XXXXX-YY) represent your account number
- the Ys (UA-XXXXXX-YY) represent view (profile) numbers within your account
Profile (View)
A profile is an individual Google Analytics report created for a property. You can have several different profiles under the same property.
This can be useful, because you can choose to apply a filter of some sort to your profile, depending upon your requirements.
For instance, you should have one profile showing all of your Analytics data, untouched with no filters.
However, if you are an international company, you could create a separate profile to filter out all traffic except for traffic you receive from certain countries.
Alternatively, filter out your office IP, so visits from you and your staff don’t count towards your traffic.
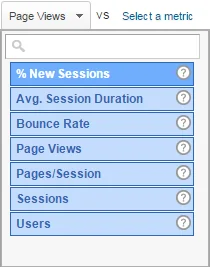
Dimensions vs. metrics: What's the difference?
When browsing Google Analytics, you will come across two distinct types of data: Metrics and Dimensions.
Dimensions are categories, and examples include: Source, Landing Page, Browser, Screen Resolution, Country / Region.
Metrics are data in relation to these dimensions (categories). Examples include: Visits, Page Views, Bounce Rate, and Conversion Rate.
Goals
Before you begin measuring and tracking your data, your website should always have at least one primary goal.
A goal, within the realm of Google Analytics, is created to "track a success". Ultimately, it represents any positive objective you wish a visitor to your website to act upon or complete.
The following would be considered goals:
- An e-commerce transaction
- A certain amount of page views per day
- An average amount of time spent on your site
- A specific URL (page) visited on your website
Let's walk through setting up a specific page-visit (URL) goal for your Google Analytics profile.
To begin, navigate to the "Admin" section of your Analytics account. From here, look under the profile (URL) you wish to create the goal for.
From the list, you should see a flag icon and the word "Goals".
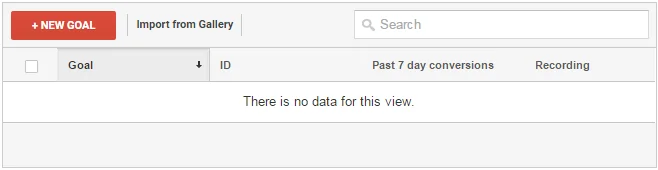
Click the "New goal" button and the "Goal Set-Up" page will appear.
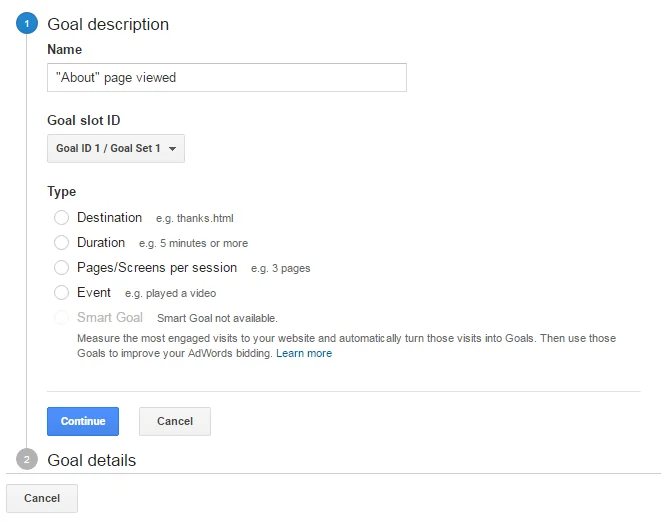
As the image below demonstrates, you can add the name of your goal as well as the goal type.
Our goal type, for this example, will be a URL destination (specific web page).
Move on to the next step.
Now add the URL extension of the page you wish to track as a goal. In this example, we are tracking our "About Us" page, so, the URL in question would be http://yourdomain.co.uk/about/.
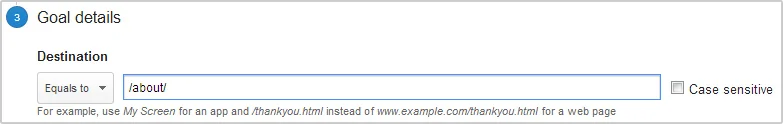
You will only need to add the "/about/" path, though, not the entire URL.
Then hit "Verify Goal" to see how many times your goal has converted based upon Analytics data from the last 7 days.
You should receive a percentage figure here, which acts to confirm that the goal has been set up correctly.
You can now hit "Create Goal" to confirm.

Key Google Analytics reports
Now let's go over some of the most important reports found within Google Analytics and explain the types of metrics and data you will encounter.
As mentioned earlier, Google Analytics is a hugely detailed reporting tool which can be used to glean massive amounts of data for all types of websites.
As this may be your first experience with Google Analytics, we'll focus on key areas to get you started.
Most of the reports we'll discuss can be found on the left-hand navigation bar at any time within your Google Analytics reporting pages.
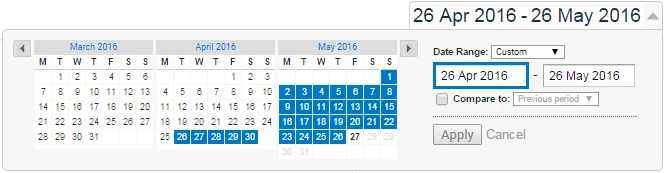
You can, in most instances, choose a specific time period in which to view any particular data.
You can choose to view yesterday's data on its own, or data from the last week, month, or year.
You can even view all of the data Google Analytics has ever recorded for your site.
Look for the data box/dropdown data menu at the top-right hand side of most pages.
Real-Time
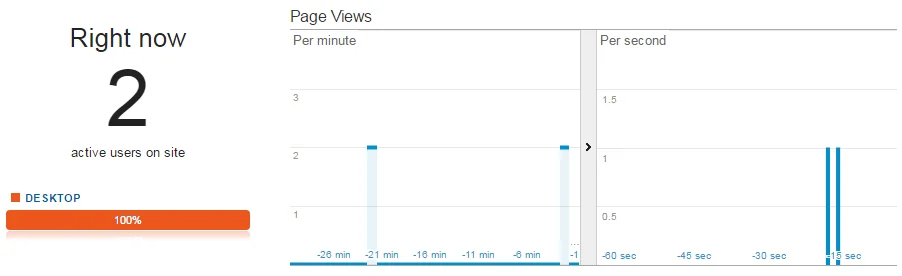
A fairly recent addition to Google Analytics is Real-Time reporting. As the title suggests, this feature allows you to see your website's analytics and data in real time.
You can get instant information about who is on your website at any given time, how they got to your site, where in the world they are from, and what pages they are clicking on.
All live, right before your eyes.
Real-Time is particularly useful (and exciting) when you are launching a social media or email campaign, or anytime you are expecting an influx of traffic.
It's always worth checking into Real-Time every now and then. Before long, you’ll start to see patterns as to how many people are on your site at any particular time.
If you notice you have zero people viewing your website, when usually at that time you would have an average of 50, you know something is wrong!
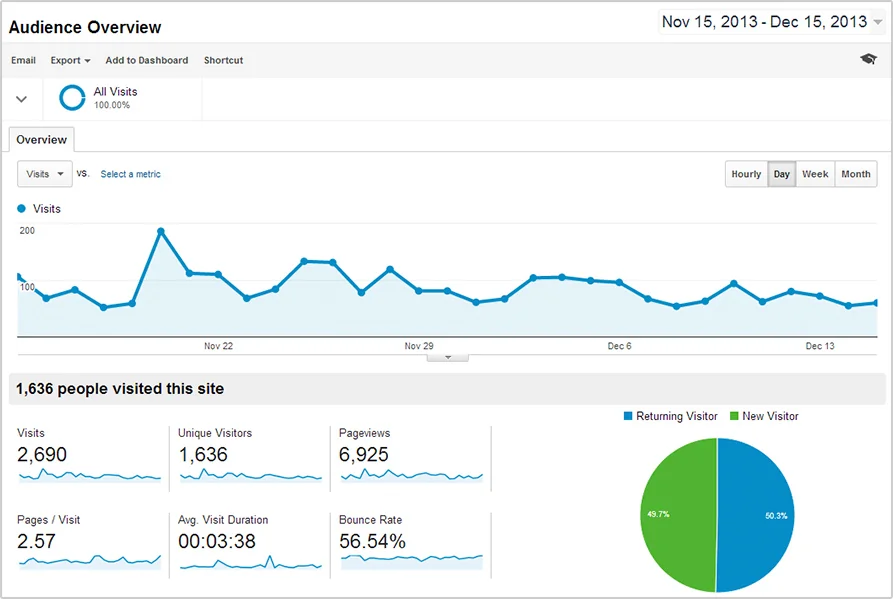
Audience
The Audience report gives you a wealth of information about the visitors themselves.
Dimensions include: Location (of your visitors), Language, Web Browser, Operating System, New Visitors vs. Returning Visitors, Desktop vs. Mobile or Tablet Visits.
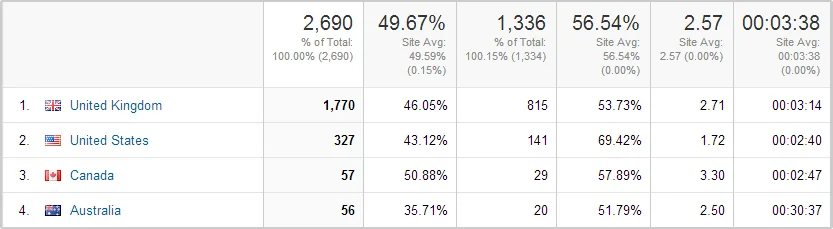
Using this data, you can start to build a picture of your average visitor, identifying the optimal language or region upon which to focus your website, the web browsers most commonly used to visit it, and the number of visitors viewing your site via tablet or smartphone.
You may discover, for example, that 5% of traffic comes via an old version of Internet Explorer that your website does not support. 5% of 1,000 visitors is still 50 visitors, so data such as this can help you make sure you don’t miss opportunities for making your website compatible.
Acquisition
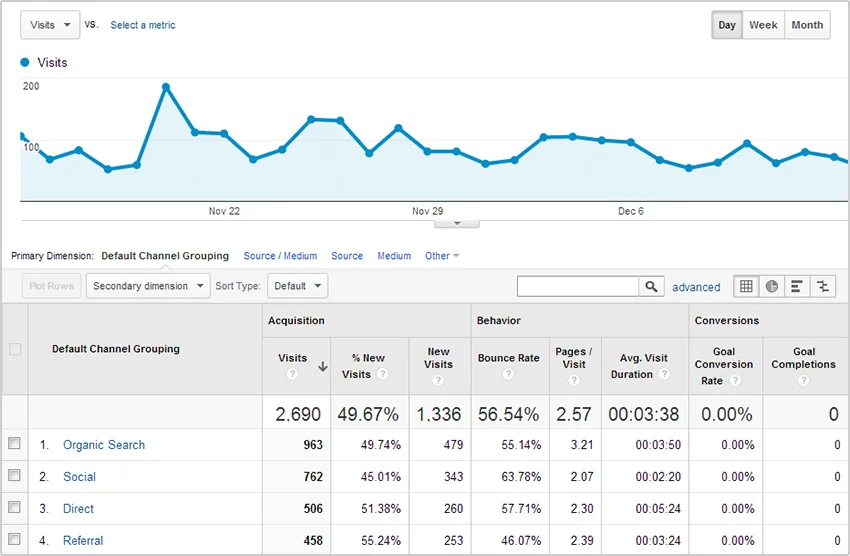
The Acquisition report contains what is probably your most valuable data, and allows you to see your traffic levels in addition to how people found (and clicked through to) your website.
The Acquisition overview page (below) will give you a high-level view of the exact routes people are taking to reach your website.
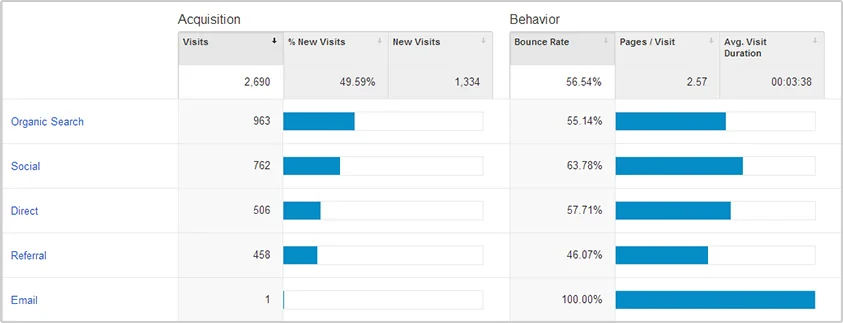
Let's go over some of the important metrics under the Acquisition heading.
Channels
Google Analytics defines channels, quite simply, as the pathways used to access your website.
The primary methods are: Organic Search, Paid Search (Google AdWords), Direct (via your URL), Social, Email, Referral, Other (e.g., paid ads outside of the Google network such as Facebook Ads).
You can drill down into all of these channels to access specific information and data.

All traffic
All Traffic doesn't need too much explaining.
This segment gives an overview of all the traffic you have received within selected time periods. It's the best place to look for a quick peek at your traffic levels.
All referrals
If you have noticed a huge increase of traffic in a short span of time, All Referrals is the first place to check.
A referral is a link elsewhere on the web by which another website links to a specific page on your own site.
Here, you may see URLs from social platforms like Facebook and Twitter, if you use them, or perhaps your website was posted on a relevant forum or message board.
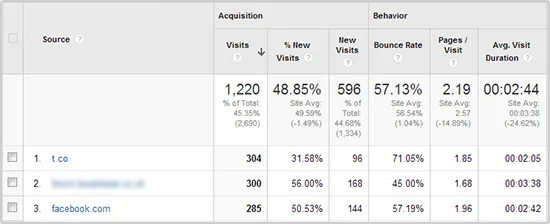
Click on the referral “source” to see the pages on your website the referrer is sending traffic to.
Some referral sources will make total sense, but from time to time, you may spot some unlikely sources.
When you do find a new referrer sending you a lot of traffic, check it out and look into how you can further improve upon this source.
Keywords
Historically, the keywords report functioned as one of the most invaluable data sets in Google Analytics.
It was a great way to see how time-consuming keyword research and on-page SEO efforts were working — by identifying successful keywords and phrases vs. those that needed to be re-focused.
The keyword section is now broken down into two sections: Paid and Organic (under the “Campaign” heading of the “Acquisition” section.
Anytime the word "paid" is mentioned within Analytics, it refers to paid advertising - usually through Google properties such as AdWords.
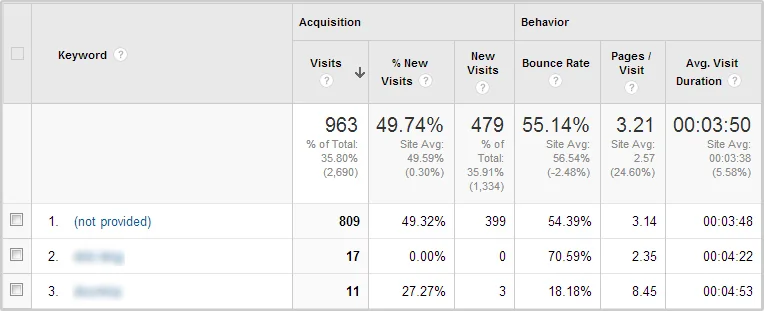
"Organic" applies to any traffic that has been referred to you organically via non-paid Google search results.
Unfortunately the organic keyword section has now been rendered almost useless by Google’s “not provided” data…
Google Analytics and "not provided" data
In an attempt to make searching the internet safer for the end user, Google has introduced SSL search (Secure Sockets Layer).
In short, this means that during a Google search, the data provided by the searcher is encrypted (secured) when being passed along to Google.
When someone searches the Google index, however, keyword data may not be displayed on your Google Analytics dashboard. Initially, this impacted only a small number of searches, but the total number has continued to increase.
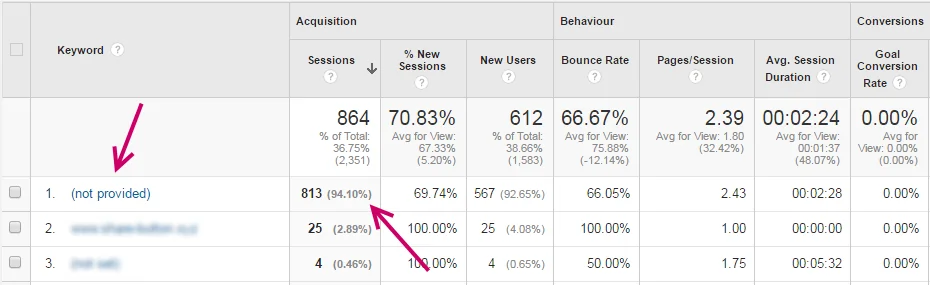
Reports by numerous users claim they are seeing more over 90% of their Google Analytics keyword data listed as "not provided".
This trend looks set to continue as Google seeks to expand its SSL search service.
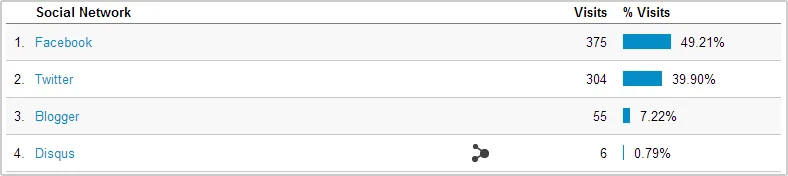
Social
Social is another useful report to Google Analytics. Social analytics give you a way to help measure the impact of your social media efforts.
You can track on-site and off-site user engagement with your website and its content, and tie it all back into your goals and conversions.
According to Google, this is how they measure your social impact:
Sources & Pages
Identifying social networks and communities in which people are discussing and sharing your website and its content.
Social Plug-ins
Measuring your user engagement levels on your website.
Conversions
Measuring the value of your social media efforts by tracking your goals, conversations and e-commerce transactions.
Social Visitors Flow
Comparing traffic volumes and visitor patterns across your website.
Social will use any Goals you have set up previously to measure how well your site is doing with regard to its business objectives.
Behaviour
The Behaviour report contains data gathered from the behaviour and actions of users visiting your website.
You can use this data to help improve the content of your site and to further meet the needs and requirements of your visitors.
Use the Behaviour section to investigate the following metrics:
- Most popular and least popular pages on your website
- The pages visitors are landing on (via searches or referrals)
- The pages visitors are exiting from
- Behaviour flow (the specific path visitors are taking through your website)
- Page load times
Certain parts of the Behaviour dashboard can seem pretty in-depth, but the most important subsection to pay close attention to would be Site Content.
Site Content gives insightful metrics about the pages and content your visitors engage with (and how they engage with both). Landing Pages and Exit Pages are particularly useful.

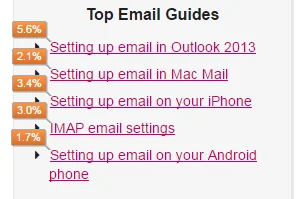
Landing pages
Here, you can get a quick overview of what your most popular landing pages are. In many cases, you will find that your home page (shown simply as "/") will be your number-one most popular landing page.
This is to be expected, as a large portion of your traffic will usually visit your website directly, by typing your URL into a web browser.
Identifying other popular pages can help you understand the type of content that brings people to your site.
Using this knowledge, you can create more of the type of content your visitors want - and get a greater number of similar, new visitors looking you up online.

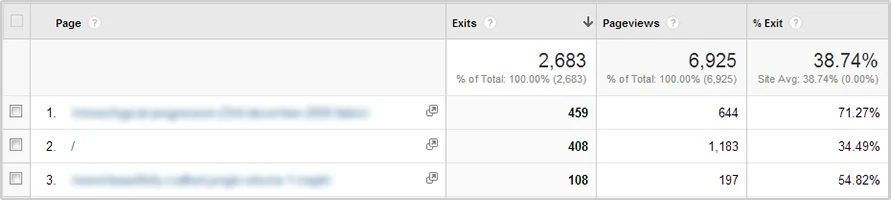
Exit pages
An exit page - the opposite of a landing page — is the one from which people exit your website.
An exit page should not always be considered negative. After all, if you have a goal such as an e-commerce transaction, you will find it quite common that people leave your website on the "thanks for your order" page.
However, if you find users leaving your site from a page other than the one you would expect them to exit from - perhaps a page elsewhere on your site, such as the home or "basket" page - you need to quickly identify exactly what aspect of that page is causing so many visitors to leave your website prematurely.
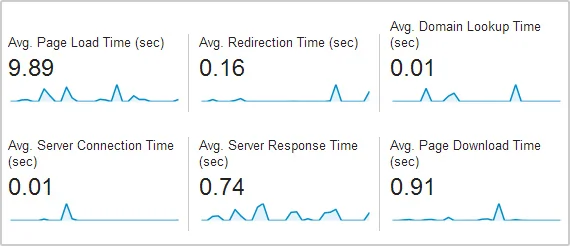
Site Speed
Much like Google's PageSpeed tool discussed in our Ranking factors (Lesson 2) guide, the Site Speed report measures the latency and performance of pages across your website.
Site Speed via Google Analytics measures the following:
Content
Which pages are the fastest and slowest, across your site?
Visitor
How do page-load times vary across different locations and areas?
Traffic Sources
Which traffic campaigns correspond to fast page-loads?
Technology
What effects do different web browsers have on your page-load times?
Be sure to pay close attention to any important pages with slow page-load times. If these are critical pages for your business website, your users are not going to hang around to wait for the page to load.
Try to identify these issues with the help of your web designer, if you have one, and get these pages loading quickly and doing their job!
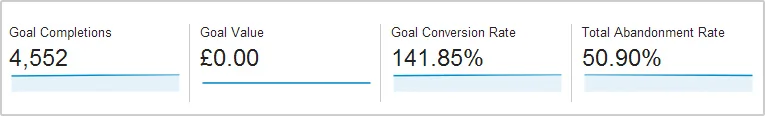
Conversions
The conversion report shows how well your site is performing in relation to your key business goals.
After all, these goals are why you created a website in the first place.
There are two main types of conversions within Google Analytics: Goal Conversion and Ecommerce Conversions.
Goal conversion
A goal conversion occurs when one of your predefined goals is completed.
As explained in our example goal earlier in the guide, when a user reaches a specified page on your website, that would represent a goal converted.
Other examples include:
- Visitors signing up to receive your newsletter
- Visitors filling in a contact form on your website
- A pre-defined amount of time spent by visitors on a page/site
- Download of an app or file
This is a great way to measure effectiveness and improve the conversion rates of your important pages.
Even small visual changes to pages such as a product page or "Contact Us" page can make a huge difference as to how well the page converts for its desired action.
Always look to be testing new ways of making these pages more appealing to your visitors.
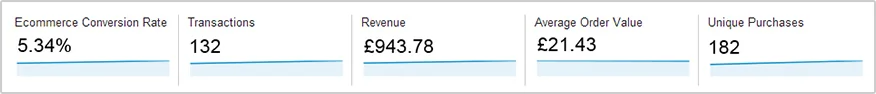
Ecommerce conversion
An e-commerce goal is simple: it is met when a visitor actually makes a purchase via your e-commerce website.
Ecommerce tracking is possible using Google Analytics, and it is a must-have if you sell goods via your business website.
In-page Analytics
In-page analytics allows you to make a visual assessment of how your site visitors interact with your pages.
This information can be tremendously useful and help answer questions such as:
- Is my page layout obvious enough? Are users doing what I want them to on a page?
- Are users seeing the right content early enough on the page
- All my calls-to-action persuasive enough?
- Are my on-page links relevant/useful for the user
In most cases you can load up an in-page view of your website within Google Analytics and see this data overlaid.
However, we recommend using the Page Analytics extension for Google Chrome, which allows you to easily toggle this feature on and off when you visit any webpage have connected to Google Analytics.
When loading up a page you’ll see a percentage over the links on your pages.
This data, for instance, will show you what links users are clicking on a page.
Using this data you can start to make an informed decision on whether these links are useful.
For example, if a highly visible link near the top of the page is not getting many clicks, perhaps your users do not deem it relevant, and perhaps you should move it somewhere less visible or consider removing it completely.
Conversely, a link out of site on the page may be exactly what your users want, and therefore it may have a high click through rate. This would be a link you might consider moving somewhere more prevalent on the page.
In-page Analytics helps you make your website and pages easier to navigate, and provide the information your users want in an easier, more digestible way.
Analytics records a tremendous amount of data, and mastering all of its features will take a lot of time and study - so much, in fact, that Google even offers a Google Analytics Individual Qualification to prove your proficiency.
Our guide, however, is designed only as an introduction to Analytics and the core features it provides. As Google says, "happy analysing".