Facebook analytics: Understanding Insights
Lesson 7 of 7 of our small business guide to Facebook
What is Facebook Insights?
Facebook Insights provides measurements on your page's performance. It’s an analytical system that provides information on a huge number of different reach and engagement metrics, and is integral to helping you find out how users engage with your page and brand.
To access Facebook Insights, go to your timeline and click on ‘Insights’ from the top menu. You will now be on the Overview page, which gives you a quick summary of all recent and important data at a glance.
It’s important to note that you always have the option to export the data on the page you are looking at in .csv or .xls format for further analysis.
Let’s go through some of the key areas (tabs) you’ll encounter inside Insights.
Likes tab
The ‘likes’ tab shows you all the different ‘like’ metrics for your page over a specific period of time. On the first row you can set the time period you wish to view – just give a start and end date for the data you wish to see.
On the “Total Page Likes as of Today” row, you can see a scale charting all your page’s ‘likes’ over the specific time scale you have seen.
This is an easy way to see your page growth and identify the ability of any activities to drive new fans to like your page.

‘Net Likes Changed’ shows the different types of likes you received over the same period of time.
You can view your organic likes, paid likes and net likes, and a get visualisation of how many ‘unlikes’ your page received on any given day in the set time period.
This is useful data to help you see what content was posted on specific days and the types of actions this prompted from your fans.
The final row under the ‘Likes’ tab is entitled ‘Where Your Page Likes Happened, another very valuable data set which can help you identify where on Facebook exactly people are liking your page.
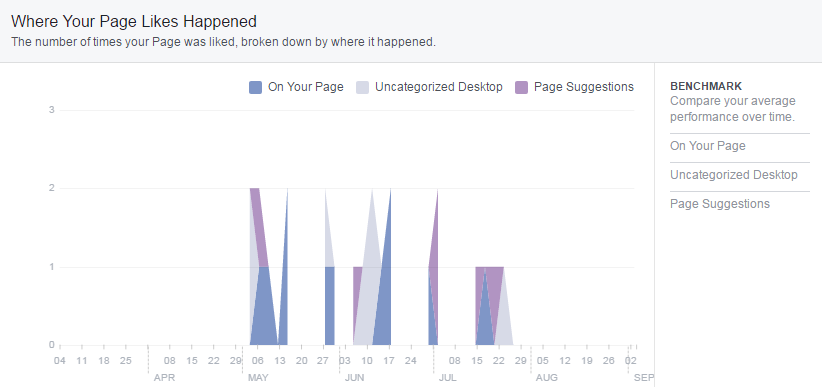
All these data set sets help you understand the growth of your page and where that growth is coming from.
Reach tab
Your ‘reach’ is the amount of people who have seen your posts. These people might not have engaged with your post, or even be fans of your page, but they have seen your post in their newsfeed.
If your post appears in a newsfeed without that person having already ‘liked’ your page, they are seeing it because a friend of theirs has engaged with the post (liked, commented or shared).
This tab allows you to compare the following metrics:Post Reach, Likes, Comments and Shares, Hide, Report as Spam and Unlikes, Total Reach.
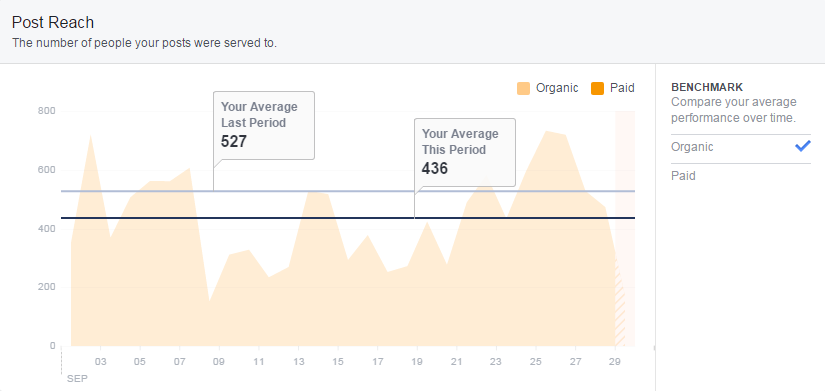
The ‘Post Reach’ bar will show you both your organic and paid reach metrics during a specific time. You can easily tell from the spikes which posts have been effective in reaching a wider audience.
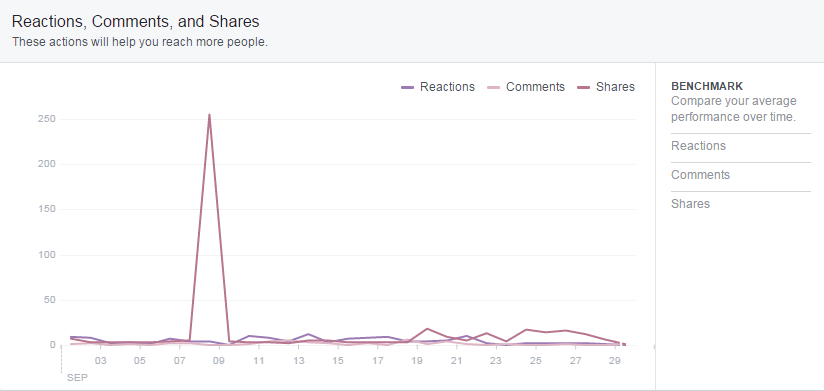
Reactions, Comments, and Shares’ will show you which posts showed what type of engagement. Here, you can filter by engagement type. Simply click on the type of engagement (on the right-hand side) to isolate the metric.
You can use this over a long date period, for instance, to investigate the type of content you have posted that attracts the most shares.
Hide, Report as Spam, and Unlikes is very straightforward. It’s worth checking this regularly to check for any spikes. If you see any, have a look at what content your fans didn’t like, and learn from it!
Total Reach is just the total number of people who saw any activity from your page including posts, posts by other people, ads, mentions and check-ins. This is another good metric to measure your page’s success over time.
Page views tab
This page measures how users engage with your entire Facebook page as opposed to individual posts. From here you can view the complete total of views your page had, or break it down by how many views each section of your page had.
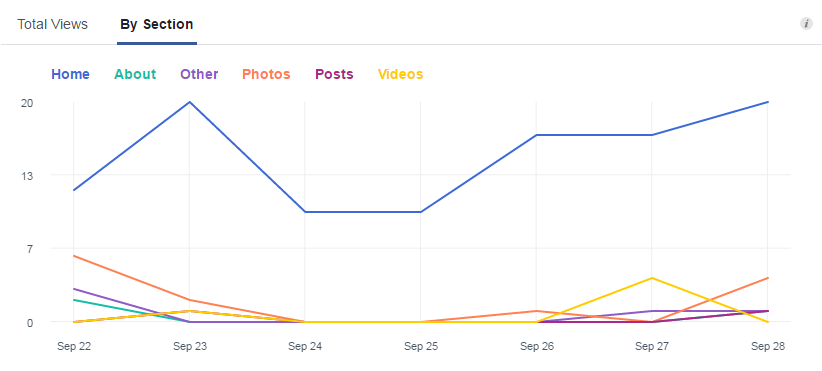
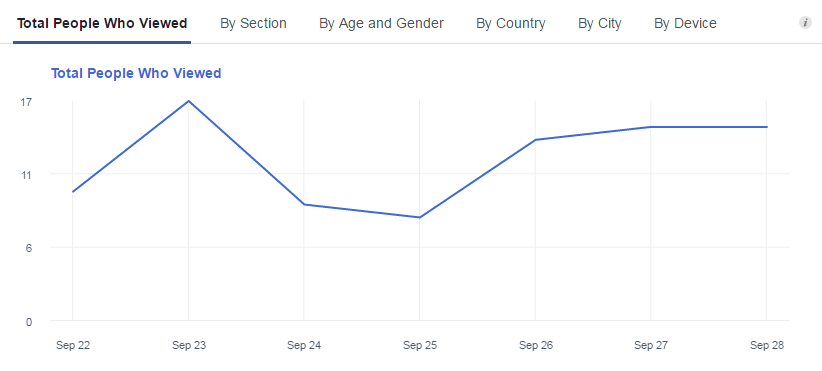
The next box shows the total of different people who views your pages and sections, instead of total views (which includes repeat views by the same user). You can break down this data even more by viewing certain demographics such as age, gender, country and device.
The final section on this tab will show the Top Sources of traffic to your page. From here you can find out who is referring web traffic to your page, so you’ll expect to see your website here, as well as any other sources that send visitors your way.
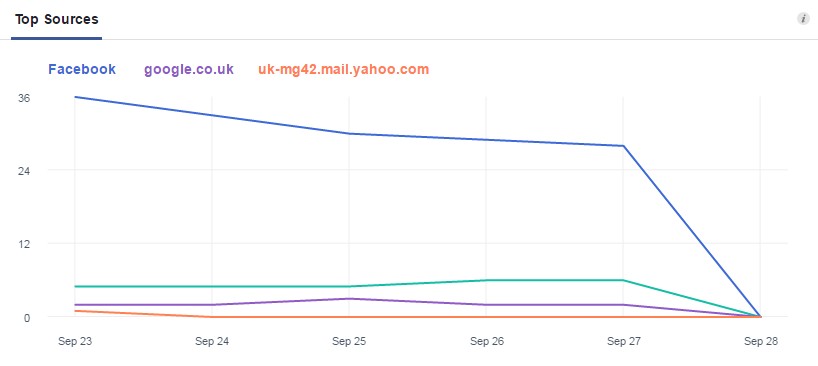
This section very handy if you have created an app for your page tabs, such as a newsletter subscription area or game.
Page Views will give you an overview of the traffic to your page and tabs at a glance.
Posts tab
The posts tab is perhaps the tab you will end up visiting the most.
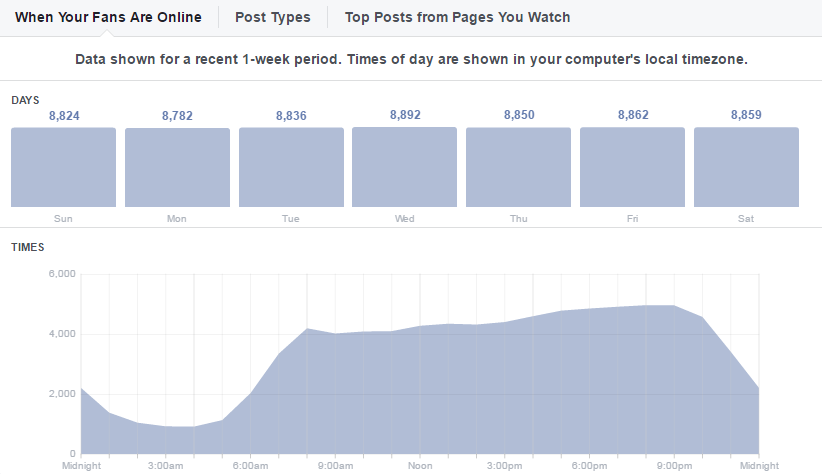
The first data set you’ll see is 'When Your Fans Are Online'. As we mentioned in previous lessons, not all of your fans will be online all day, every day. Some of them log in infrequently and at specific times.
Here, you can see when, on average (from a recent one-week period) your fans are online.
The chart below shows that most of the fans from this page are online in the evening, peaking at 8 pm. Combine this data with the Scheduled Post tool, and you have a very effective way of ensuring you send your posts out at the optimum time!
Clicking on the 'Post Types' tab at the top of this chart will show you a similar set of metrics, but this shows "the success of different post types based on average reach and engagement".
On average, this page manages to reach the most people with simple text updates. Text updates, as mentioned previously, often engage users and result in lots of comments, a high indicator of a valuable and quality post.
The final section of the 'Posts' tab is the 'All Posts Published' section. From here, you can analyse the engagement and reach levels of every single post you have published.
You can easily arrange posts by data published, type, reach and/or engagement levels. Using the down arrows from the top of the sheet, you can also choose to display organic or paid reach combined, or show only by type of engagement such as post clicks, likes, or engagement rates.
You can drill-down further into the statistics for each post by clicking on the post title itself, which will open a new light box window.
In the right-hand column of this light box, you can see in-depth details about how this individual post performed. At the top, you get a final figure of total people reached, along with the combined levels of engagement of the post.
These metrics are broken down even further so you can see where this engagement came from, and they also display the total amount of clicks the link attracted.
This is a hugely important feature for tracking the performance of your posts, especially if you are posting to a large fan base or running a promoted ad campaign.
People tab
On the people tab, you can get an overview of the type of people making up your page community. Who are the people that like your page? Where do they come from? What is their average age?
All of this data and more can be gleaned from the People tab. You will notice three separate sections for this tab: Your Fans, People Reached, and People Engaged.
The Your Fans' tab provides a simple overview of where your fans are: first by country, then city, and finally by what language they use. Hover over the bar segments for more information on that metric.
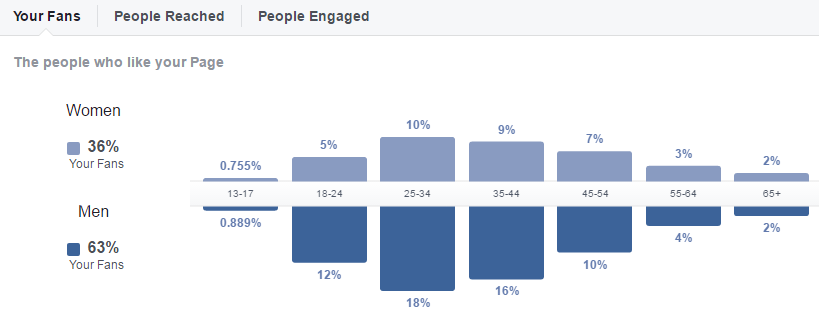
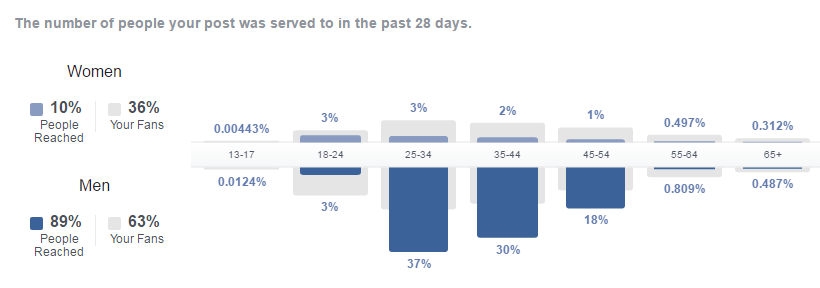
The 'People Reached' tab is laid out exactly the same as the 'Your Fans one. However, instead of showing the demographics of your fans, it shows the demographics of the people your posts have reached (fans and non-fans).
Depending on who your key demographic is, the data here may not vary too much from that of 'Your Fans', if you assume your fans are connected with friends of a similar demographic.
Finally, we move on to the 'People Engaged' tab. It is laid out much the same, but shows you the demographics of everyone who has engaged with your posts (fans and non-fans).
If you notice any trends of people engaging with your content who are not represented on the 'Your Fans' tab, it's worth trying to target that group (by country. city, gender or age) to help further build your fan base.
Facebook Insights is a fantastic tool to help provide page owners with the information they need to run their Facebook page effectively. Insights offers the data to help you make the right decisions and make sure your fans see content that is of most interest to them.
That's a wrap
Congratulations, you’ve completed our beginners guide to Facebook marketing and you can now apply these new found skills to get the most out of your Facebook page and business.
Hungry for more? We’ve only scratched the surface of what there is to know about Facebook – especially when it comes to Facebook Ads. But thankfully Facebook has launched a new learning resource called Facebook Blueprint.
Facebook Blueprint will teach you, in-depth, about topics such as Facebook Ads, Insights, Facebook Apps, Webinars, and everything in-between.
Sign up today, it’s completely free and it’s set you on the road to becoming a Facebook master.
